Abstract
From one gateway’s log: 72,956 requests with cache counters from one operator’s coding agents to 18 providers. A warm request (90% or more read) takes a median of 2.4 s under 16K prompt tokens and 13.1 s at 512K or more, for replies of 300 tokens or fewer: a hit is not free. A cold request (under 10% read) takes 3.0 times as long at 200K to 500K tokens (2.7 matched on provider and model; 95% interval over sessions and provider-days 2.4 to 3.7), and 3.8 at 500K or more, 2.3 without the session with 44 of its 79 cold requests. At an assumed read price of a tenth, a cold request has 9.8 times the input cost of a warm one per prompt token. At 200K or more, 99.2% of requests had a live cache when the same session, provider and model was used under 1 minute earlier, 48.5% at 64 minutes or more (194 requests; six providers, a rough 15.6% to 83.8%).
Introduction
Prompt caches make long contexts affordable. In the traffic of coding agents 94 to 96% of prompt tokens are read from a cache [1, 2]. What a hit and a miss cost in time is less well measured at such lengths. An evaluation on live agent sessions found the time to the first token 6 to 31% lower across four models with the best of three cache modes (13 to 31% across providers in its abstract), and 60% lower for one model at 50K tokens in a prompt-size ablation [3]. A trace of two coding agents shows, for one, a median residual time to the first token rising from about 1.5 s near 12K tokens of input to about 2.9 s near 185K, without separating hits from misses [1]. A study of agent serving shows, in one benchmark trace, prefill time rising with context and varying with the uncached tokens [4]. The hit rate falls with idle time, to a median near 0 to 5% beyond ten minutes in the traces of one coding assistant [5]; in those of two coding agents almost all steps miss after one hour [1]; at a 5-minute cache lifetime 59.4% of one deployment’s sessions had an eviction [4]. Probes of three hosted providers with a 100K-token prefix after a 30-minute pause give a first-token time 1.9 to 3.4 times as long cold as kept warm (our ratios) [6]. We found no measurement of request time against prompt length beyond 200K tokens on real traffic, split by cache state.
This note gives one, from the gateway log of [2]: the time of a request as a function of its prompt length, for prompts read from the cache and for prompts that were not, with the sessions and not the requests as the unit of uncertainty, and adds the cost of a miss at an assumed cache-read price and, as a check of [1, 5] on other traffic, the share of requests with the cache alive by the pause since the previous request, by provider.
Data
The log. The log is the request log of our own gateway on the author’s workstation: every session in it is one of the author’s command-line coding agents. The gateway forwards each request to one of many model providers and writes a line when the request ends [2]. Our extract keeps times, token counts, a session number and numbers for provider and model. Of 104,088 answered requests with a prompt size, 72,956 (70%) carry cache counters and are studied: 18 of 23 providers, 31 models, 94 sessions; 99.97% of the studied requests fall between 3 and 13 October 2026. A request is studied when its own log line shows that the provider reported cache counters, so a missing count is never read as a miss (in the earlier lines of the log, which carry no flag, the cache-read count decides: 3,080 of the 17,017 with counters among the 20,122 requests at 200K or more). Of the 31,132 left out, 64.9% come from five providers that never report counters, 28.2% from eight that report on only some requests and 7.0% have no provider.
Definitions. K is 1,000 tokens. The prompt is the plain input plus the tokens written to the provider’s prompt cache plus the tokens read from it. A request is warm when 90% or more of its prompt was read from the cache, cold when less than 10% was, and partial otherwise: 80%, 6% and 14%. The time of a request is the gateway’s timer for the provider that answered, from sending the request to the end of that provider’s reply; it leaves out earlier providers that failed (8% of requests) and may include a repeat on the same provider. The log has no time to the first token, so we use the 51% of requests with replies of 300 tokens or fewer, unless said otherwise. Medians (linear interpolation) are compared by their ratio. The unit of uncertainty is the session, or the provider and day for requests without one. Intervals are 95% percentile intervals over 100,000 resamples of whole units and cover the choice of units only.
Results
Table 1. Request time for warm and cold requests with replies of 300 tokens or fewer (upper edges exclusive). Units: sessions, or provider and day for requests without a session. Matched: warm requests reweighted to the cold requests’ mix of provider and model. Last column: without the unit that has the most cold requests.
| Prompt tokens | Warm requests | Warm median, s | Cold requests | Cold units | Cold median, s | Cold over warm, medians (95% interval) | Matched on provider and model | Without the largest unit |
|---|---|---|---|---|---|---|---|---|
| Under 100K | 15,763 | 3.4 | 2,251 | 81 | 5.1 | 1.5 (1.0 to 1.8) | 1.1 | 1.6 |
| 100K to 200K | 6,613 | 4.0 | 64 | 23 | 9.5 | 2.4 (1.7 to 2.7) | 2.2 | 2.3 |
| 200K to 500K | 5,404 | 5.5 | 110 | 21 | 16.8 | 3.0 (2.4 to 3.7) | 2.7 | 3.0 |
| 500K or more | 2,584 | 12.7 | 79 | 11 | 47.9 | 3.8 (1.3 to 5.1) | 3.7 | 2.3 |
| 200K or more | 7,988 | 6.8 | 189 | 26 | 23.8 | 3.5 (2.4 to 6.1) | 3.5 | 2.9 |
A hit is not free. A warm request takes a median of 2.4 s under 16K prompt tokens, 4.3 s at 128K to 256K and 13.1 s at 512K or more, where half lie between 8.2 and 20.6 s (Figure 1a). Between the median prompts of the last and the third-last group, 728K and 176K, that is 1.6 s per 100K more prompt tokens, nearly all of them read from the cache. Within each of the ten providers with 30 or more warm requests in both groups the figure is positive, from 0.3 to 2.4 s with a median of 0.6: the pooled figure is raised by the provider mix at the longest prompts.
A miss takes about three times as long once the prompt is long. At 200K to 500K tokens a cold request takes 16.8 s against 5.5 s warm, 3.0 times as long (2.9 to 3.2 without any one unit; Table 1). At 500K or more the ratio is 3.8 (47.9 against 12.7 s), but 44 of the 79 cold requests belong to one session; without it the ratio is 2.3 (27.7 against 12.0 s); the interval of 3.8 runs from 1.3 to 5.1. Over 200K or more together it is 3.5, 3.5 matched and 2.9 without the largest session. Under 100K tokens the pooled 1.5 is an effect of the provider and model mix: matched, it is 1.1.
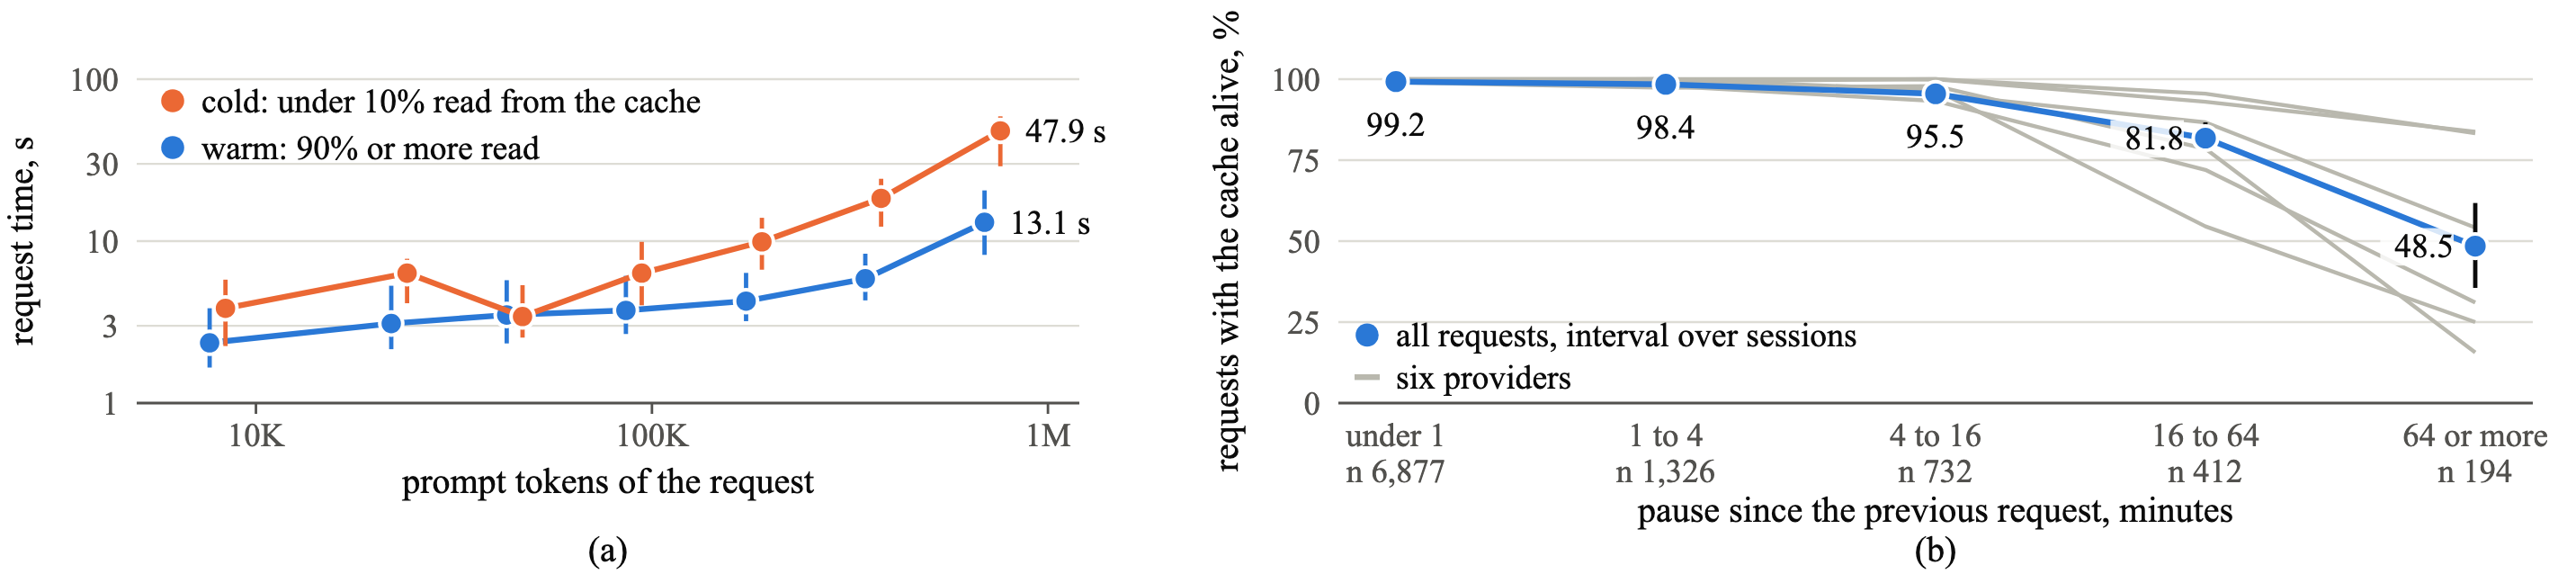
Figure 1. (a) Median request time by prompt length for warm and cold requests with replies of 300 tokens or fewer; bars span the middle half. (b) Share of requests of 200K or more with the cache alive by the pause since the previous request (same session, provider and model): all requests with the 95% interval over sessions, and six providers in grey.
The ratio moves between 2.8 and 4.0 with the definitions. At 200K or more it is 2.8 when cold means under 20% read from the cache and 3.1 under 50%, the definition of [2]; 4.0 and 3.2 with reply limits of 100 and 1,000 tokens, 3.0 over replies of any length, 3.2 without the requests that were sent again or went to a second provider, and 3.6 without the 18 of the 189 that report no token read and none written (28 of 447 over replies of any length). One pair of provider and model has 20 cold and 30 warm requests at that length: 68 cold over 5 days (36% of all), ratio 3.7.
Cold long requests follow long pauses, another provider or a changed prompt. The previous request is that of the same session and requested model. Of the 447 cold requests at 200K or more, with replies of any length, 38% come after a pause of more than five minutes on the same provider, where 6% of the warm ones do; 13% come after another provider answered (1% of the warm ones; [2] counts 42% of its cold requests with the previous request of any model; [5] finds an average hit rate of 8% after a model switch); 21% come within a minute on the same provider (81%), 6% after one to five minutes, 7% are the first of their model in the session and 15% carry no session. 12% were sent again with a changed prompt (warm: 1%).
The share of requests whose cache is alive falls with the pause, and differs by provider. The previous request is the last one of the same session, provider and model that ended before this one began; a request is alive when at least 10% of its prompt was read from the cache. At 200K or more, 9,541 of 17,017 requests, from 29 sessions, have one. The alive share falls from 99.2% under 1 minute to 48.5% at 64 minutes or more (194 requests from 24 sessions, 29 reading 90% or more; interval over sessions 35.6 to 61.8; 51.2% without the session with most cold requests; Figure 1b). The median pause there is 145 minutes; 57.7% are alive at 64 to 256 minutes (130 requests) and 29.7% beyond (64). The pause is that of one provider and model: in 168 of the 194 the session meanwhile used another model or provider, and with the session idle 8 of 26 were alive. Six of 14 providers with a pause record have 20 or more requests at 64 minutes or more, from 7 to 14 sessions each, and are alive in 15.6 to 83.8% of them (18.8 to 88.2% at 64 to 256 minutes; Figure 1b); these shares are rough. This confirms the fall with idle time of [1, 5] and the differences between providers of [6]; alive counts a request at 10% read, so it is not their hit rate. [2], with the gap from the session’s last request of any provider and cold as under half read, has 91.4% of its 58 requests beyond an hour cold (70.7% at the 10% line); here, with the gap of one provider and model, 51.5% of the 194. At the assumed price their input cost per prompt token is 7.6 times the median warm request’s, against 1.1 under 1 minute.
At an assumed price a miss costs about ten times a hit. No price paid is used: a token read from the cache is assumed to cost a tenth of an uncached input token, written tokens count as uncached, the reply is left out. Counted: at 200K or more the median cold request has 416,570 uncached tokens, the median warm one 734 (447 and 16,054 requests), and 95.4% of all prompt tokens are read from the cache. A cold request costs 9.8 times a warm one per prompt token (19.3, 4.0 and 2.0 at read prices of 0.05, 0.25 and 0.5); the median cold request reads almost none of its prompt and the median warm one 99.8%, so the price sets the ratio. Cold requests, 2.6% of the requests with counters at 200K or more, are 61.3% of the uncached tokens, 20.0% of the summed input cost (30.2 to 5.5% at 0.05 to 0.5) and 7.4% of the summed time. For comparison, [4] finds evictions at 31.5% of cost under a 5-minute cache lifetime, and [1] as an upper bound puts the cost avoidable by keeping the cache through human thinking time at 12.8% of priced cost over its two agents (16.2 and 8.5% each).
Limitations
These are observations, not an experiment, and the 189 cold requests with replies of 300 tokens or fewer at 200K or more come from 21 sessions and 5 provider-days only. Cold requests arise in particular situations, after pauses and changes of provider, so they differ from warm ones in more than the cache; matching on provider and model removes one such difference. The time includes sending the prompt and the reply, which the log cannot split (a warm request under 100K tokens takes 3.3 s with fewer than 100 output tokens and 53 s with more than 3,000; at 200K or more the median reply is 203 tokens when cold and 122 when warm, and matching on reply length gives 2.9 and 3.4 at 200K to 500K and at 200K or more), and each provider’s load at the moment is unknown. One operator, one gateway, ten days: other clients, providers and weeks may differ; requests without counters, shorter overall, are left out.
The cost rests on one assumed price, input side only; its ratios (a tenth for reads, a 25% premium on writes, five times for replies) follow a public price list used in [4]. The premium acts on 140 of 447 cold and 5,562 of 16,054 warm requests that report written tokens and leaves the ratio at 9.8; replies at five times an input token, 9.4. A pause cannot be told apart from eviction under load, a rewritten prompt or a gateway move, so no cache lifetime follows. The curve omits 4,372 requests without a session, 3,020 overlapping an earlier request of their cache (1.5% cold each) and 84 first requests of a cache (66.7% cold); at the half-prompt line, 23.2% are alive at 64 minutes or more.
Recommendations
- Budget time for the prompt even when it is cached: here 0.3 to 2.4 s per 100K tokens within a provider (1.6 pooled), and 13.1 s for a warm request at 512K or more.
- Keep a long session on one model and provider; do not rewrite its prompt: 13% of cold long requests followed another provider (warm: 1%), and 168 of the 194 gaps of 64 minutes or more in one model’s use went to another.
- Quote request time with prompt length, cache state and reply length, cost with its read price; compare cold and warm within provider and model, count sessions: at 500K or more one session moved the ratio from 2.3 to 3.8.
Disclosure. The analysis was produced with AI coding agents under the author’s direction. All numbers were recomputed from an extract of the gateway’s log (times, token counts, numbers in place of provider and model names). No request content was read.
References
- K. Zhu, M. Jacob, C. Ma, et al. TraceLab: Characterizing coding agent workloads for LLM serving. arXiv:2606.30560, 2026.
- Y. Akinin. Long prompts of one operator’s coding agents: 19% of requests carry 200K tokens or more, two or more such requests overlap 9% of the time. AVELIN AI Lab Research Note, October 2026. https://avelin.ai/lab/long-prompts-of-coding-agents-through-one-gateway
- E. Lumer, F. Nizar, A. Jangiti, et al. Don’t break the cache: An evaluation of prompt caching for long-horizon agentic tasks. arXiv:2601.06007, 2026.
- C. Chang, Y. Zhou, K. Fu, et al. From LLM inference to agentic workloads: Characterization and implications for serving systems. arXiv:2608.15127, 2026.
- B. Liu, H. Qiu, Í. Goiri, et al. Agentic coding in the wild: Characterizing GitHub Copilot traces at production scale. arXiv:2608.00101, 2026 (version 1).
- M. Khailo. Keeping the cache warm pays: Keepalive economics for agentic workloads. arXiv:2607.19214, 2026 (version 2).
How to cite
Y. Akinin. A Cold Prompt Takes 3.0 Times as Long as a Cached One at 200K to 500K Tokens (2.4 to 3.7). AVELIN AI Lab Research Note, October 2026. https://avelin.ai/lab/a-cold-prompt-takes-three-times-as-long
@techreport{akinin2026coldprompt,
  title       = {A Cold Prompt Takes 3.0 Times as Long as a Cached One at 200K to 500K Tokens (2.4 to 3.7)},
  author      = {Akinin, Yury},
  institution = {AVELIN AI},
  year        = {2026},
  month       = oct,
  url         = {https://avelin.ai/lab/a-cold-prompt-takes-three-times-as-long}
}