Abstract
Published traces of coding agents show prompts of tens to hundreds of thousands of tokens, almost all read from a cache. We add an independent trace and the quantities that size a long-context server. The trace is the request log of one gateway used by one operator’s command-line coding agents: 104,088 requests over 15 days with a hole of 2.4 days, 98% of them in the last ten, 141 sessions, token counts only. The median prompt is 74K tokens and the mean 140K; 19.3% of requests carry 200K tokens or more and 5.6% carry 500K or more, and the first group holds 60% of all prompt tokens. Where cache counters exist, 94.1% of prompt tokens are read from the cache and the median request brings 1,186 fresh tokens. Of the requests of 200K or more with counters 4.4% are cold, 77 a day counted, two fifths of them after the gateway moved the session to another provider. Three sessions make 34% of the long requests. Over 9.6 days at least one request of 200K or more was in flight 28.9% of the time and two or more 8.9%, with a peak of 11; for 500K or more the figures are 15.4%, 1.9% and 4. Prompt tokens in flight exceeded 2.3 million 1% of the time.
Introduction
The public traces of language-model services made before 2025 show short prompts: medians of 1,020 and 1,500 tokens for a conversation and a coding service [1], a mean of 8,590 in a one-hour sample of another [2]. Coding agents changed that. Traces of two command-line agents show, for one of them, a median prefix of 126K tokens per step, read back from the cache, and a 99th percentile of 918K; over both, 95.7% of prompt tokens are found in the cache, and the median step appends 857 and 886 tokens for the two agents [3]. A production study of an editor’s agent reports a median prompt of 68K tokens per call, 63K of them cached, and a cache of little use after ten idle minutes [4]. A third study finds that 59.4% of coding-agent sessions lose their cache at least once under a five-minute lifetime [5].
Those studies describe the workload. A server with a long context window, where cache memory is the scarce resource [6] and one cold long prompt slows every other stream [7], also needs to know how many long prompts are in flight at once and how often one arrives cold. We did not find either published; idle gaps are partly covered in [4, 5]. This note measures all of them on the traffic of one operator and repeats the published quantities on it as a check.
Data
The log. The log is the request log of our own gateway on the author’s workstation: every session in it is one of the author’s command-line coding agents. The gateway forwards each request to one of many model providers and writes a line when a request ends: the time, the duration of each attempt, the status and the token counts that the provider returned. It keeps no text. We cut the log down to those columns, a session number and a mark for requests answered by another provider than the session’s previous one; the extract carries no client, model or provider name. Over 15 days there are 109,577 request lines. 0.6% failed and 4.4% of the answered ones have no prompt token count; the remaining 104,088 are studied. 98% of them fall in the 9.6 days from 3 October 18:06 UTC to the last line, about 10,600 a day; rates and overlaps use that window.
Definitions. K is 1,000 tokens. The prompt of a request is its plain input plus the tokens written to the provider’s prompt cache plus the tokens read from it. Fresh tokens are the prompt minus the tokens read from the cache: text appended since the last request, and whatever the cache missed. Cache counters exist for 70% of the requests; a request is cold when less than half of its prompt was read from the cache. A request is in flight from its end minus the duration of all its attempts until its end. A session is the gateway’s conversation key, taken from the client’s session header or derived from the start of the conversation; it is present on 85% of the requests and takes 141 values.
Results
Table 1. Requests by prompt length (K = 1,000 tokens; upper edges exclusive). The last four columns use the requests with cache counters. Cold: less than half of the prompt read from the cache.
| Prompt tokens | Requests | Share, % | Of all tokens, % | From cache, % | Fresh tokens, median | Fresh tokens, 90th pct. | Cold, % |
|---|---|---|---|---|---|---|---|
| Under 32K | 18,864 | 18.1 | 2.7 | 73.3 | 2,544 | 17,409 | 22.1 |
| 32K to 100K | 45,158 | 43.4 | 18.3 | 90.4 | 1,445 | 14,523 | 6.3 |
| 100K to 200K | 19,944 | 19.2 | 19.3 | 95.3 | 926 | 7,285 | 3.8 |
| 200K to 500K | 14,326 | 13.8 | 31.0 | 95.4 | 858 | 6,199 | 4.1 |
| 500K or more | 5,796 | 5.6 | 28.6 | 95.4 | 722 | 4,143 | 5.0 |
| All | 104,088 | 100.0 | 100.0 | 94.1 | 1,186 | 12,357 | 8.1 |
A fifth of the requests carry 200K tokens or more. The median prompt is 74K tokens, the mean 140K, the 90th percentile 351K, the 99th 908K, and the longest 1.05 million, the size of the largest context window (Table 1, Figure 1a). 19.3% of requests are at 200K or more and hold 60% of all prompt tokens; 5.6% are at 500K or more and hold 29%. The published traces are of the same order, ours close to [4] and shorter than one agent of [3]. Among our requests with counters the median prompt is 81K and the median read from the cache 74K, against 68K and 63K in [4]. By tokens read from the cache, 33.2% of our requests with counters are at 128K or more and 17.4% above 256K; [3] has 48.5% and 23.7% of the steps of one agent, and 42.2% and six steps of the other, computed from the step counts of its Table 9. The shares move from day to day: over the 9 UTC days with at least 5,000 requests the share at 200K or more ran from 12% to 32% and the median from 57K to 129K.
Almost all of a long prompt is read from the cache. Where counters exist, 94.1% of prompt tokens are cache reads (95.7% in [3]); the share is 73.3% for prompts under 32K and 95.4% at 200K or more. The median request brings 1,186 fresh tokens, and 722 to 926 above 100K, where a session is mostly a long row of requests that each resend a slightly longer prompt. Cold requests are 22% of the short ones and 3.8 to 6.3% of the rest. At 200K or more 4.4% of those with counters are cold. The window has about 2,090 such requests a day, 85% with counters, and 77 cold ones a day were counted (91 if the rest are alike); at 500K or more, 27 of 600. Not all of them are a cache that expired: 17% of the long requests with counters and an earlier request in their session came after the gateway had moved to another provider, and then 14.7% are cold against 3.1% otherwise. 42% of the cold long requests follow such a move, so the cold share depends on how the gateway routes.
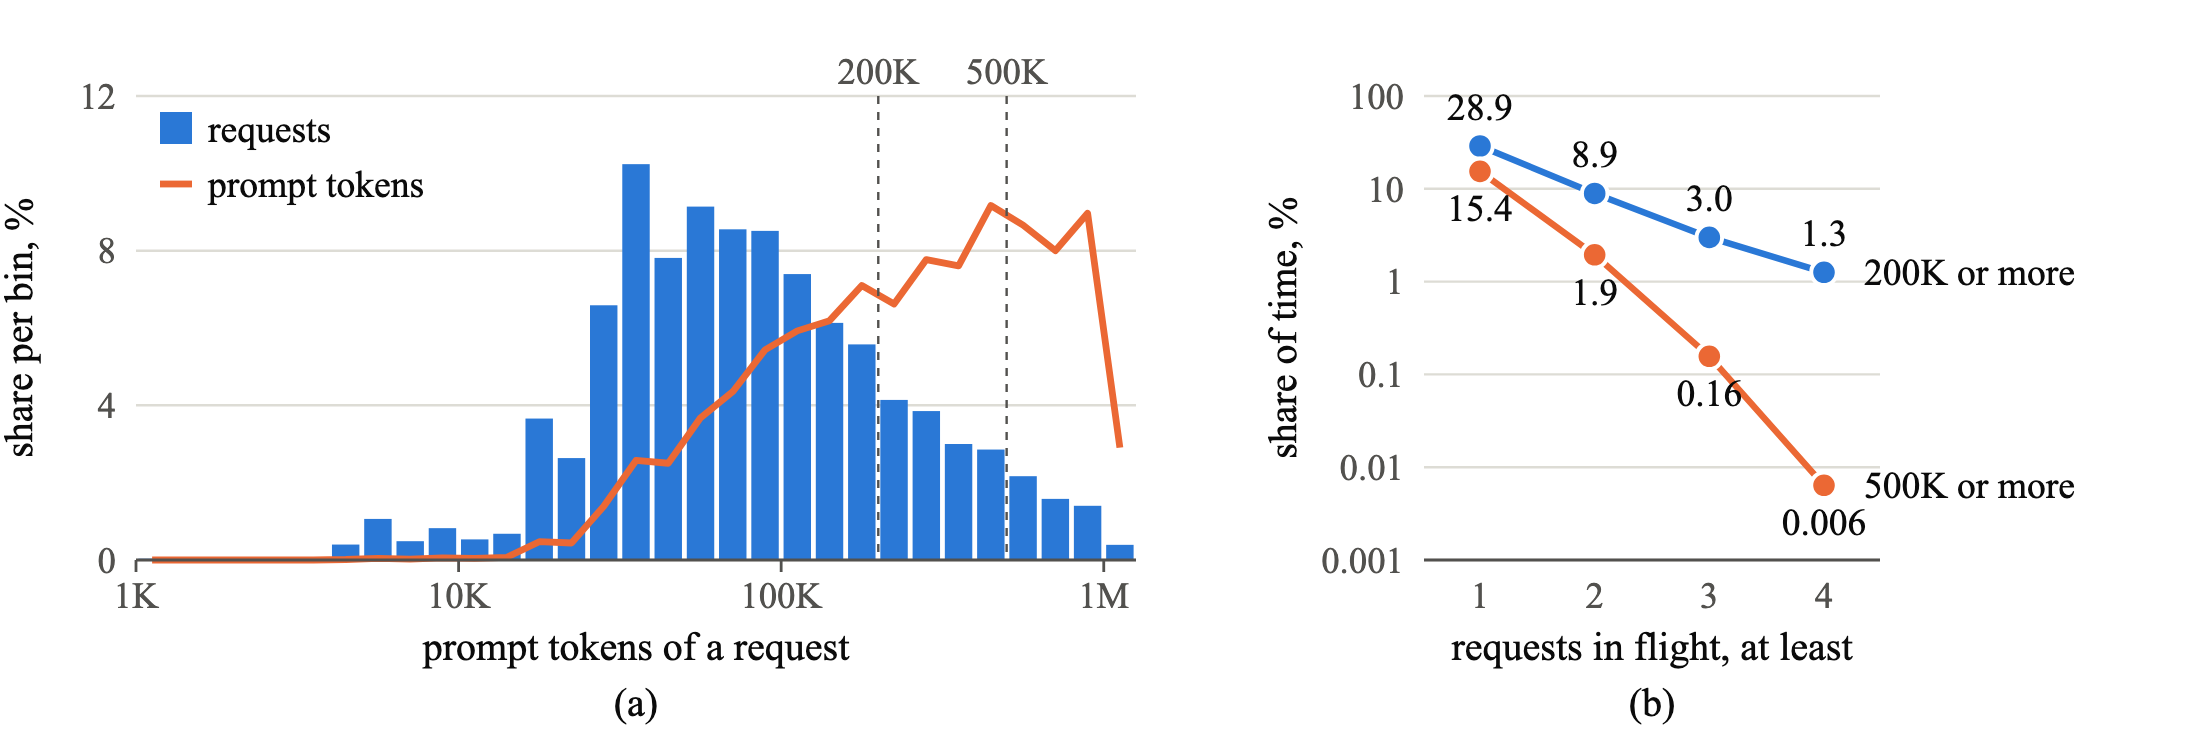
Figure 1. (a) Requests and prompt tokens by the prompt length of the request, in bins of a tenth of a decade; the last bin ends at the largest context window. (b) Share of time over 9.6 days with at least the given number of requests in flight whose prompt is 200K tokens or more, and 500K or more.
A few sessions make the long requests. Half of the 141 sessions have 3 requests or fewer; a tenth have more than 1,655, and the largest has 11,370. 31 sessions reach 200K tokens and 18 reach 500K. Three sessions make 34% of all requests at 200K or more and ten make 58%, with 22% carrying no session; at 500K or more, 43% and 79%. Without the three sessions with the most such requests, the share of requests with a session that are at 200K or more falls from 17.7% to 13.5%, and at 500K or more from 5.4% to 3.5%.
Long requests overlap rarely, but they do. Some request was in flight 60% of the time. One of 200K tokens or more was in flight 28.9% of the time and two or more 8.9%; the count stayed at 4 or below 99% of the time and peaked at 11 (Figure 1b). For 500K or more the same figures are 15.4%, 1.9%, 2 and 4. Counting only the attempt that answered gives 27.6% and 8.0%, and 14.4% and 1.6%. Summed over the requests in flight, the prompts held a median of 62K tokens, 1.0 million at the 90th percentile of time and 2.3 million at the 99th, with a peak of 4.6 million. A cache also holds the sessions that will return: the latest prompts of the sessions with a key seen in the last five minutes add up to at least 2.5 million tokens at the 99th percentile of time, and those of the last hour to 4.0 million.
Sessions pause for seconds, and a long pause costs the cache. 45% of a session’s requests start while another of its requests is in flight. For the rest, the time since the session’s last request ended has a median of 1.7 seconds, a 90th percentile of 3 minutes and a 99th of 30 minutes; 7.3% of these gaps exceed five minutes, 3.4% ten minutes and 0.4% an hour. The longer the gap, the more often a long request arrives cold: 2.6% within a minute, 7.3% after one to five minutes, 15.5% after five to ten, 32.6% after ten minutes to an hour and 91.4% after more than an hour (of 5,798, 1,266, 187, 513 and 58 requests). In [4] the cache is nearly gone after ten minutes; here two thirds of the 513 long requests that came after ten minutes to an hour still read half of their prompt from it.
Limitations
One operator, one gateway and ten days of dense traffic: 141 sessions, of which three dominate the long requests, so the shares describe this traffic and not coding agents in general. Requests without a session (22% of the long ones) are longer than the rest, 29% against 18% at 200K or more. Cache counters come from 70% of the requests and from 23 to 100% of a day’s requests, because the mix of providers changed; requests with counters are longer, 23% against 10% at 200K or more. The longest prompts equal the largest window, so the tail is cut there. The in-flight figures are reconstructions from end times and durations, without queueing and without the 5% of lines that failed or have no prompt size, and they are the service times of many providers added together; another server’s speed would change them. A session key can join two conversations or split one, and parallel requests share it, so a gap is the time until the session’s next request of any kind. The cache lifetimes behind the cold shares are the providers’ and mostly unknown to us.
What it means for a server
- Size the cache for the prompts in flight and for the sessions that will return. On this traffic the prompts in flight held 2.3 million tokens at the 99th percentile of time, and the keyed sessions of the last five minutes at least 2.5 million, of the last hour 4.0 million.
- Expect cold long prompts every day, 77 counted here at 200K or more and 27 at 500K or more, and keep them from stalling the streams that are generating [7].
- A session that pauses for more than five minutes is rare here (7.3% of gaps), but a cache that forgets it turns about a thousand fresh tokens into a prompt of hundreds of thousands. A tier in host memory makes a long lifetime cheap [6].
- Quote a prompt-length distribution with its population and its dates: ours moved between 12% and 32% at 200K or more from one day to another.
Disclosure. The analysis was produced with AI coding agents under the author’s direction. All numbers were recomputed from an extract of the gateway’s log that holds times, token counts, session numbers and a mark for provider changes. No request content was read.
References
- P. Patel, E. Choukse, C. Zhang, et al. Splitwise: Efficient generative LLM inference using phase splitting. In ISCA, 2024. arXiv:2311.18677.
- R. Qin, Z. Li, W. He, et al. Mooncake: A KVCache-centric disaggregated architecture for LLM serving. arXiv:2407.00079, 2024 (version 5, 2026).
- K. Zhu, M. Jacob, C. Ma, et al. TraceLab: Characterizing coding agent workloads for LLM serving. arXiv:2606.30560, 2026.
- B. Liu, H. Qiu, Í. Goiri, et al. Agentic coding in the wild: Characterizing GitHub Copilot at production scale. arXiv:2608.00101, 2026 (version 1).
- C. Chang, Y. Zhou, K. Fu, et al. From LLM inference to agentic workloads: Characterization and implications for serving systems. arXiv:2608.15127, 2026.
- Y. Akinin. A host-RAM tier for the KV cache: Up to 33× sooner after eviction, 16% of cache misses served in production. AVELIN AI Lab Research Note, October 2026.
- Y. Akinin. Reading a long cold prompt starves generation: 2–5% of normal speed at the default chunk. AVELIN AI Lab Research Note, October 2026.
How to cite
Y. Akinin. Long Prompts of One Operator's Coding Agents: 19% of Requests Carry 200K Tokens or More, Two or More Such Requests Overlap 9% of the Time. AVELIN AI Lab Research Note, October 2026. https://avelin.ai/lab/long-prompts-of-coding-agents-through-one-gateway
@techreport{akinin2026agentprompts,
  title       = {Long Prompts of One Operator's Coding Agents: 19% of Requests Carry 200K Tokens or More, Two or More Such Requests Overlap 9% of the Time},
  author      = {Akinin, Yury},
  institution = {AVELIN AI},
  year        = {2026},
  month       = oct,
  url         = {https://avelin.ai/lab/long-prompts-of-coding-agents-through-one-gateway}
}