Abstract
We read where the time of requests goes from the counters of one production inference server with a context window of a million tokens that serves agentic sessions: 31.5 hours, 17.9 of them active, and 18,364 finished requests. Of the summed request time, 62% is generating, 16% reading the prompt and 17% waiting in the queue. Most of the prompt is not computed: a request has 130,000 prompt tokens on average and computes 18,800. The time sits in a tail. The first token comes within a second for 71% of requests, and the 8% that take more than ten seconds hold at least 61% of all time to the first token; the 5% of requests that wait more than ten seconds hold at least 74% of all waiting. In the last 2.7 hours a request took 17.9 s on average against 7.3 s in the first 26, with fewer requests per active hour but more in the server at once (3.8 against 2.1); requests that computed more than 100,000 prompt tokens were 10.2% of all instead of 2.7%. Of the 10.6 s added, 4.7 were generating, 4.1 waiting and 1.8 reading; whether those prompts caused the rest, the counters cannot show.
Introduction
The latency of a language model server is usually given as a time to the first token and a rate of tokens per second. An operator also needs to know where the time of requests goes: waiting in the queue, reading the prompt, or generating. Published work gives parts of the answer. In one production study of agentic coding sessions, seen from the client with no view of the server, LLM execution "takes 85.4% of wall-clock time" [1]. A study of an agent platform with more than ten thousand GPUs assigns 76.1% of the request time of its high-demand sessions to the time after the first token, waiting included [2]. Benchmark runs of agents on one serving instance put reading the prompt at 4.4 to 5.1% of request time with the cache intact; raising concurrency until the cache is thrashed makes it 6.6 to 8.4% and cuts generation throughput by up to 66% [3]. We found no production measurement that separates waiting from reading and generating, and none for a context window of a million tokens.
This note gives one for a single GPU, from the server’s own counters. Earlier notes measured parts of the same server: its cache tier in host memory [4], its draft head [5] and, in its production records, generation starved while long prompts are read [6].
Data
One NVIDIA H200 runs an open-source inference server with a large mixture-of-experts language model, a context window of a million tokens, a prefix cache on the GPU, a second tier of that cache in host memory [4] and a draft head for speculative decoding [5]. The GPU holds 76.6 GiB of weights, 4-bit integers for the expert matrices, beside a KV pool of 55.9 GiB; an embedding table of the model, about 47 GiB, is kept in pinned host memory. Its clients are internal agentic sessions. For every finished request the server counts the time it waited in the queue, the time from scheduling to the first token (reading the prompt), the time from the first token to the last (generating) and the whole time, each as a sum and as a histogram with fixed bounds, and its prompt tokens, computed prompt tokens and generated tokens. The time to the first token is counted when the token leaves, so it also covers requests that did not finish. We took three read-only snapshots of the counters, 26, 28.9 and 31.5 hours after they began; the last holds 18,364 finished requests and 18,453 first tokens. The server’s log adds a line of statistics every ten seconds, except when no token was read or generated in that interval and the one before. An interval with a request running or waiting, or with tokens read or generated, counts as active: 17.9 of the 31.5 hours. A histogram gives counts between bounds: a percentile is reported as the pair of bounds that encloses it, shares of requests within a bound are exact, and the share of time held by the requests beyond a bound is a lower bound, the larger of two taken from the lower and the upper edges of the cells.
Results
Three fifths of the summed time is generation. While active, the server held 2.5 requests at once on average. A request took 8.8 s on average: 1.5 s waiting, 1.4 s reading the prompt and 5.5 s generating 788 tokens. Of the summed request time that is 17%, 16% and 62% (Figure 1a); the remaining 4%, 0.4 s per request, is in none of the three counters. These are shares of time, not of requests. The 21% of requests that took more than ten seconds hold at least 63% of the time; the median request waits under 0.3 s, generates 1.5 to 2 s and ends within 2.5 to 5 s (Table 1).
Most of the prompt is not computed. A finished request had 130,000 prompt tokens on average and computed 18,800 of them. Of all prompt tokens the server took in, 81.1% were found in the cache on the GPU, 4.5% were brought back from host memory and 14.5% were computed. The computing is uneven: the median request computed between 2,000 and 5,000 tokens, and the 4.0% of requests that computed more than 100,000, called heavy below, hold at least 57% of all computed tokens. Per second of reading time the server computed 13,100 prompt tokens. Reading is 16 to 17% of request time in every stretch of the run; benchmark runs on another model and GPU report 4.4 to 5.1% with the cache intact and 6.6 to 8.4% with it thrashed [3].
Table 1. Parts of a request over 31.5 hours: 18,364 finished requests, and 18,453 first tokens for the third row. Last column: the least share of the part’s summed time held by the requests that spent more than ten seconds in it.
| Part of a request | Mean, s | 50th percentile between, s | 90th percentile between, s | 99th percentile between, s | Within 1 s, % of requests | Within 10 s, % of requests | Over 10 s, % of requests | Over 10 s, least % of the time |
|---|---|---|---|---|---|---|---|---|
| Waiting in the queue | 1.5 | 0 to 0.3 | 0.3 to 0.5 | 30 to 40 | 91 | 95 | 4.9 | 74 |
| Reading the prompt | 1.4 | 0.3 to 0.5 | 1 to 1.5 | 30 to 40 | 87 | 97 | 3.1 | 49 |
| To the first token | 3.3 | 0.5 to 0.75 | 5 to 7.5 | 40 to 80 | 71 | 92 | 8.3 | 61 |
| Generating | 5.5 | 1.5 to 2 | 10 to 15 | 50 to 60 | 30 | 87 | 12.7 | 52 |
| Whole request | 8.8 | 2.5 to 5 | 20 to 30 | 60 to 120 | 9 | 79 | 21.1 | 63 |
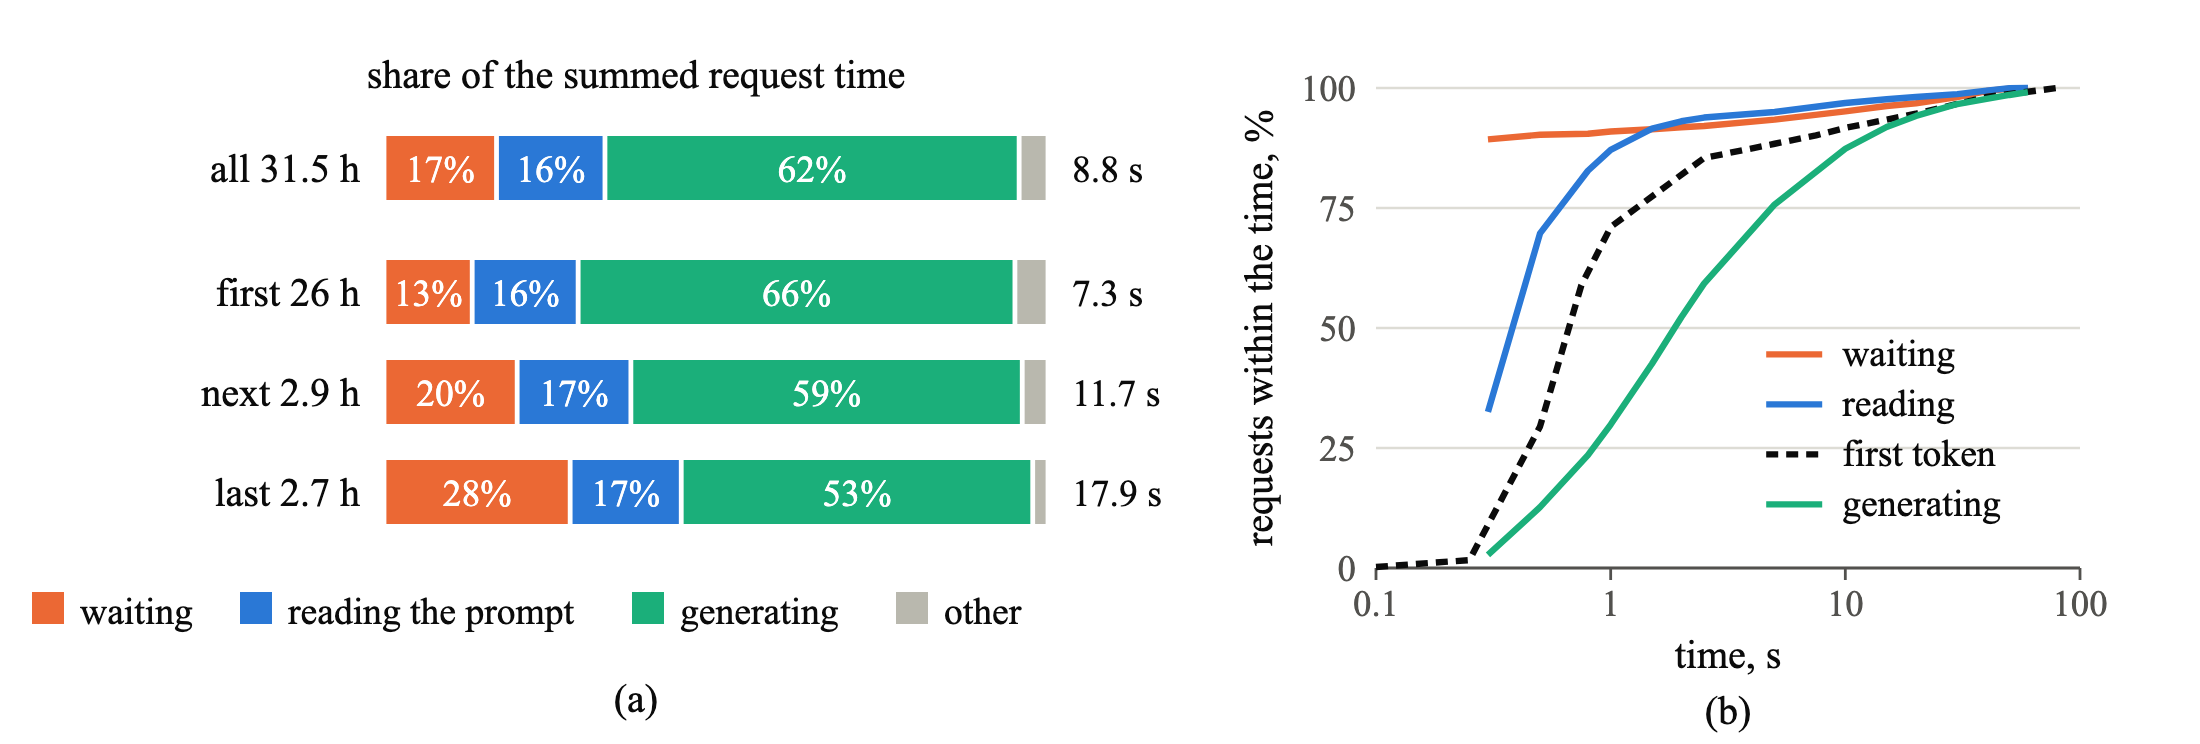
Figure 1. (a) Share of the summed request time spent waiting in the queue, reading the prompt and generating, over the whole run and in its three stretches between snapshots; the mean time of a request is at the right. (b) Share of requests whose waiting, reading, time to the first token and generating took no more than the given time; the lines join the bounds of the server’s histograms.
Most first tokens come within a second, and the tail is long. The median time to the first token lies between 0.5 and 0.75 s, and 71% of requests had it within a second, 92% within ten (Figure 1b). The mean is 3.3 s because of the tail: the 8% above ten seconds hold at least 61% of all time to the first token.
Waiting is rare and long. 89% of requests waited less than 0.3 s and 91% less than a second. The 5% that waited more than ten seconds hold at least 74% of all waiting, and reading has the same shape (Table 1). Waiting includes requests set aside while the host tier is looked up, which the log counts among the waiting. Sampled every ten seconds, they are 17% of the waiting requests the log shows; the server’s counter of lookup delay holds less, 1,264 s.
Requests take 2.5 times as long in the stretch with the most prompt tokens to compute. In its last stretch the server finished fewer requests per active hour than in its first (768 against 1,037) and held more at once (3.8 against 2.1); active hours grow with the length of requests, so neither figure is the load that was offered. Prompts were about as long (136,000 against 127,000 tokens), and a request took 17.9 s on average instead of 7.3 (Table 2). The median request computed 2,000 to 5,000 prompt tokens in every stretch. Heavy requests were 2.7% of the first stretch and 10.2% of the last, 28 and 78 per active hour, and held at least 49% and 76% of the computed tokens; the mean per request went from 15,300 to 39,500. Reading grew in step, 2.6 times, at the same 13,200 tokens a second, and is the smallest of the three added parts, 1.8 of 10.6 s. Waiting added 4.1 s. Generating added 4.7 s, 9.5 s instead of 4.8 for 9% fewer tokens. The acceptance of drafts explains little: a decoding step gave 2.8 tokens against 3.0, while the mean gap between a stream’s steps went from 18 to 38 ms. Engine steps were fuller, 335 tokens against 103.
Table 2. The run by stretch. Heavy: requests that computed more than 100,000 prompt tokens; tokens/s: per generating second.
| Stretch | Active hours | Requests per active hour | Heavy requests, % | Computed prompt tokens per request | Waiting, s | Reading, s | Generating, s | Whole request, s | Generated tokens per second of generating | Waited over 10 s, % |
|---|---|---|---|---|---|---|---|---|---|---|
| First 26 h | 13.5 | 1,037 | 2.7 | 15,300 | 1.0 | 1.2 | 4.8 | 7.3 | 168 | 2.9 |
| Next 2.9 h | 2.7 | 1,151 | 7.3 | 25,600 | 2.3 | 2.0 | 6.9 | 11.7 | 108 | 8.7 |
| Last 2.7 h | 1.7 | 768 | 10.2 | 39,500 | 5.0 | 3.0 | 9.5 | 17.9 | 77 | 16.7 |
| All 31.5 h | 17.9 | 1,029 | 4.0 | 18,800 | 1.5 | 1.4 | 5.5 | 8.8 | 144 | 4.9 |
The counters cannot join a heavy request to the requests that waited or slowed beside it, so the cause is not shown. In the first 26 hours of this run, a fifth of the ten-second intervals with two or more requests running were starved, each stream at about 5.6 tokens a second against 103 to 158 otherwise, and the server’s report after such an episode credited a median of 282K computed prompt tokens against 16K otherwise [6]; benchmark runs that thrash the cache report the same direction [3]. Other readings remain open. The waiting of the last stretch is concentrated: of 46 episodes in the log (waiting lines no more than 20 s apart), the largest holds 31% of the waiting seen and the three largest 57%. And 30% of the waiting requests in its lines were deferred for the host tier.
Limitations
One server, one model, 31.5 hours, clients of one organisation. The counters are sums and histograms: they do not join the parts of one request, and percentiles are known only between bounds. Reading is counted from scheduling to the first token and includes the first step of generation; generating is wall-clock time from the first token to the last, so the two rates are averages over steps shared with other requests, not speeds of the hardware. Active time rests on log lines, which are missing when no token moves for two intervals even if requests wait: counting every silent gap after a busy line makes it 18.4 hours instead of 17.9. The stretches differ in length and hour of day; the last holds 1,308 requests, 133 of them heavy, and no value of a stretch carries an interval. The 89 requests with a first token and no finish are in no counter but that of the first token, where they may hold up to 13% of the time, and a request cut off while it waited is in none.
Recommendations
- Report where the time goes, not one latency: here a mean request of 8.8 s hides a median first token under 0.75 s.
- Report a tail with its weight: here 5% of the requests hold at least 74% of the waiting.
- Report the computed prompt tokens of a request and the share of heavy requests beside the hit rate: here 88% and 71% of prompt tokens not computed are 15,300 and 39,500 computed tokens for a request.
- Do not infer the latency effect of heavy prompts from reading time: here reading was 1.8 of the 10.6 s added, and whether heavy prompts caused the rest these counters cannot show.
Disclosure. The analysis was produced with AI coding agents under the author’s direction. All numbers were recomputed from three snapshots of the server’s counters and the ten-second lines of its log. No request content was read.
References
- B. Liu, H. Qiu, Í. Goiri, et al. Agentic coding in the wild: Characterizing GitHub Copilot at production scale. arXiv:2608.00101, 2026 (version 1).
- Y. Zheng, J. Jiang, D. Zhu, et al. Semantics, workflows, and infrastructure: Understanding agent serving at production scale. arXiv:2609.34432, 2026.
- Y. Yuan, A. Nayak, S. Kundu, N. Talati. Agentic AI workload characterization. arXiv:2605.26297, 2026 (version 2).
- Y. Akinin. A host-RAM tier for the KV cache: Up to 33× sooner after eviction, 16% of cache misses served in production. AVELIN AI Lab Research Note, October 2026.
- Y. Akinin. Speculative decoding on one production server: 66% of draft tokens accepted in 29 hours, 56 to 76% in four of five busy ten-second intervals. AVELIN AI Lab Research Note, October 2026.
- Y. Akinin. Reading a long cold prompt starves generation: 2–5% of normal speed at the default chunk. AVELIN AI Lab Research Note, October 2026.
How to cite
Y. Akinin. Where the Time of Long-Context Requests Goes on One Production Server: 62% Generating, 16% Reading the Prompt, 17% Waiting. AVELIN AI Lab Research Note, October 2026. https://avelin.ai/lab/where-the-time-of-long-context-requests-goes
@techreport{akinin2026timebudget,
  title       = {Where the Time of Long-Context Requests Goes on One Production Server: 62% Generating, 16% Reading the Prompt, 17% Waiting},
  author      = {Akinin, Yury},
  institution = {AVELIN AI},
  year        = {2026},
  month       = oct,
  url         = {https://avelin.ai/lab/where-the-time-of-long-context-requests-goes}
}