Abstract
Servers interleave prompt reading with generation by cutting long prompts into chunks. In the model we test, a step with a chunk lasts as long as the chunk takes and each stream advances once per step. In a controlled test, eight generating streams kept 1.8% of their character rate and at most 2.1% of their token rate while three cold prompts of 217K tokens were read at the default chunk of 8,192 tokens on an H200; a 96 GB workstation GPU gave 1.8% and at most 1.7%. In one restarted run, a chunk of 2,048 tokens gave 3.2 to 4.1 times the generation and 22% slower reading. On a production server over 26 hours, 98% of decoding-step gaps were under 25 ms, and the 1.5% of 0.1 s or more took 25 to 35% of gap time. In 21% of ten-second intervals with two or more requests running, each stream made 5.4 to 5.6 tokens per second, against 103 to 158 normally and 5.4 to 6.2 predicted by the model.
Introduction
A server that schedules iteration by iteration [1] runs prompt reading (prefill) and token generation (decode) of different requests in the same steps. A long prompt read in one piece stalls every generating stream, a generation stall [2]. Reading it in chunks, with the chunk size derived from a latency target, bounds the stall [2]; a chunk that adapts as the read proceeds has been proposed for contexts of millions of tokens [5]; and giving prefill and decode separate machines isolates them at the cost of moving state between them [3, 4]. Running both phases at once on one GPU has also been proposed; for example, within one step a kernel overlaps the attention of a prefill chunk and of the decodes on the same multiprocessors [7], and a split of the multiprocessors gives each phase its own share [8].
The evaluation in [2] uses requests of up to 16K tokens in total and token budgets of 512 to 2,048 (256 in one microbenchmark), and [5] reports that with fixed chunks decode latency grows with the context length. The servers in this note read prompts of hundreds of thousands of tokens with a chunk of 8,192 by default. We add what generation keeps there: in a controlled test on two GPU types with prompts of 217K tokens, and in 26 hours of records of a production server.
Setup
Model. Each scheduling step processes at most a fixed budget of tokens, 8,192 by default on the three servers of this note. Our model of what follows: while a cold prompt is being read, a step is filled by a chunk of that prompt and lasts as long as the chunk takes, and every generating stream advances one step per chunk. If a step of generation alone takes t_d and a step with a chunk takes t_c, generation keeps about t_d / t_c of its speed while prompts are read.
Controlled test. Eight streams generate long answers from short prompts. After 8 s three cold prompts of about 217K tokens arrive together, each with a unique first line, so that no cached prefix helps. The client counts the characters the eight streams produce while the prompts are read, until the last has its first token. The server’s ten-second reports give the tokens generated over the same stretch; they also show nine requests running and the other prompts waiting, so one prompt is read at a time. Kept is the rate during the read over the normal rate of the same machine, taken on a warmed server; for tokens, over the server report in which the prompts arrive (Section 4). Table 1 lists six runs, one each: an H200 serving a mid-size dense model (Model B) with 8-bit weights at three chunk sizes and two KV-cache precisions, and a 96 GB workstation GPU serving the same model with 4-bit weights at the default chunk, once with a 4-bit KV cache, whose prefill path is slower. Each chunk size is confirmed in the server’s log.
Production. Another H200 served a large mixture-of-experts model (Model A) to internal agentic sessions with a long context, chunked prefill on and the default budget of 8,192 tokens. We use the 26.0 hours of counters also used in our note on that server’s KV cache [6]: 13,965 finished requests, 216 million prompt tokens computed. The server’s histogram of the gaps between a stream’s consecutive decoding steps, about 3 tokens each with speculative decoding, holds 3.79 million gaps. Its ten-second reports give the tokens generated per second and the requests running. The reports credit a prompt’s computed tokens when its read completes: one report credits 894K tokens, 5 times what the server can read in ten seconds, and in the controlled runs each prompt appears in a single report. An interval in which a long prompt is still being read therefore shows requests running, almost no prompt tokens, and whatever generation is left. We call an interval busy when two or more requests are running (1,974 of 4,965 reports) and starved when it is busy with under 20 generated tokens per second per running request.
Results
Table 1. Controlled test: rates summed over eight generating streams while three cold prompts of about 217K tokens are read. Normal character rates: 5,251 per second on the H200, 2,784 on the workstation (2,513 with the 4-bit KV cache). Token baselines (607, 478, 455) are the report in which the prompts arrive, which holds the first seconds of the read: token shares are upper bounds (Section 4). Bold: share kept.
| GPU | Chunk, tokens | KV dtype | Characters/s during the read (client) | Kept, % | Tokens/s during the read (server) | Kept, % (upper bound) | First tokens of the three prompts, s |
|---|---|---|---|---|---|---|---|
| H200 | 8,192 | FP8 | 93 | 1.8 | 12.9 | 2.1 | 36 / 72 / 106 |
| H200 | 4,096 | FP8 | 188 | 3.6 | 33.2 | 5.5 | 39 / 75 / 111 |
| H200 | 2,048 | FP8 | 301 | 5.7 | 53.5 | 8.8 | 45 / 88 / 129 |
| H200 | 4,096 | BF16 | 193 | 3.7 | 34.9 | 5.8 | 30 / 56 / 84 |
| Workstation, 96 GB | 8,192 | FP8 | 51 | 1.8 | 8.2 | 1.7 | 62 / 120 / 177 |
| Workstation, 96 GB | 8,192 | 4-bit | 15 | 0.6 | 2.0 | 0.4 | 246 / 484 / 719 |
At a chunk of 8,192 tokens generation keeps about 2%. On the H200 the eight streams produced 93 characters per second against 5,251 normally, 1.8%, and 12.9 tokens per second against 607 in the baseline report, at most 2.1%, over the 106 s of reading. The workstation GPU kept 1.8% and at most 1.7% for 177 s (Table 1). The same H200 had run 64 short-prompt streams at 3,625 tokens per second without an error; none of those prompts was long.
A smaller chunk buys generation with reading time. Halving the chunk to 4,096 and then to 2,048 tokens raised generation during the read from 93 to 188 and 301 characters per second (2.0-fold, then 1.6-fold) and from 12.9 to 33.2 and 53.5 tokens per second (2.6-fold, then 1.6-fold), while the three prompts took 5% and 22% longer to read (Figure 1a; the 4,096 and 2,048 runs followed a restart, Section 4). KV-cache precision moved the share little in one run each (3.6% and 3.7% of characters at 4,096 tokens), though reading took 25% less time with the BF16 cache. A slower prefill path made it worse: with a 4-bit KV cache the streams kept 0.6% and the prompts took 719 s.
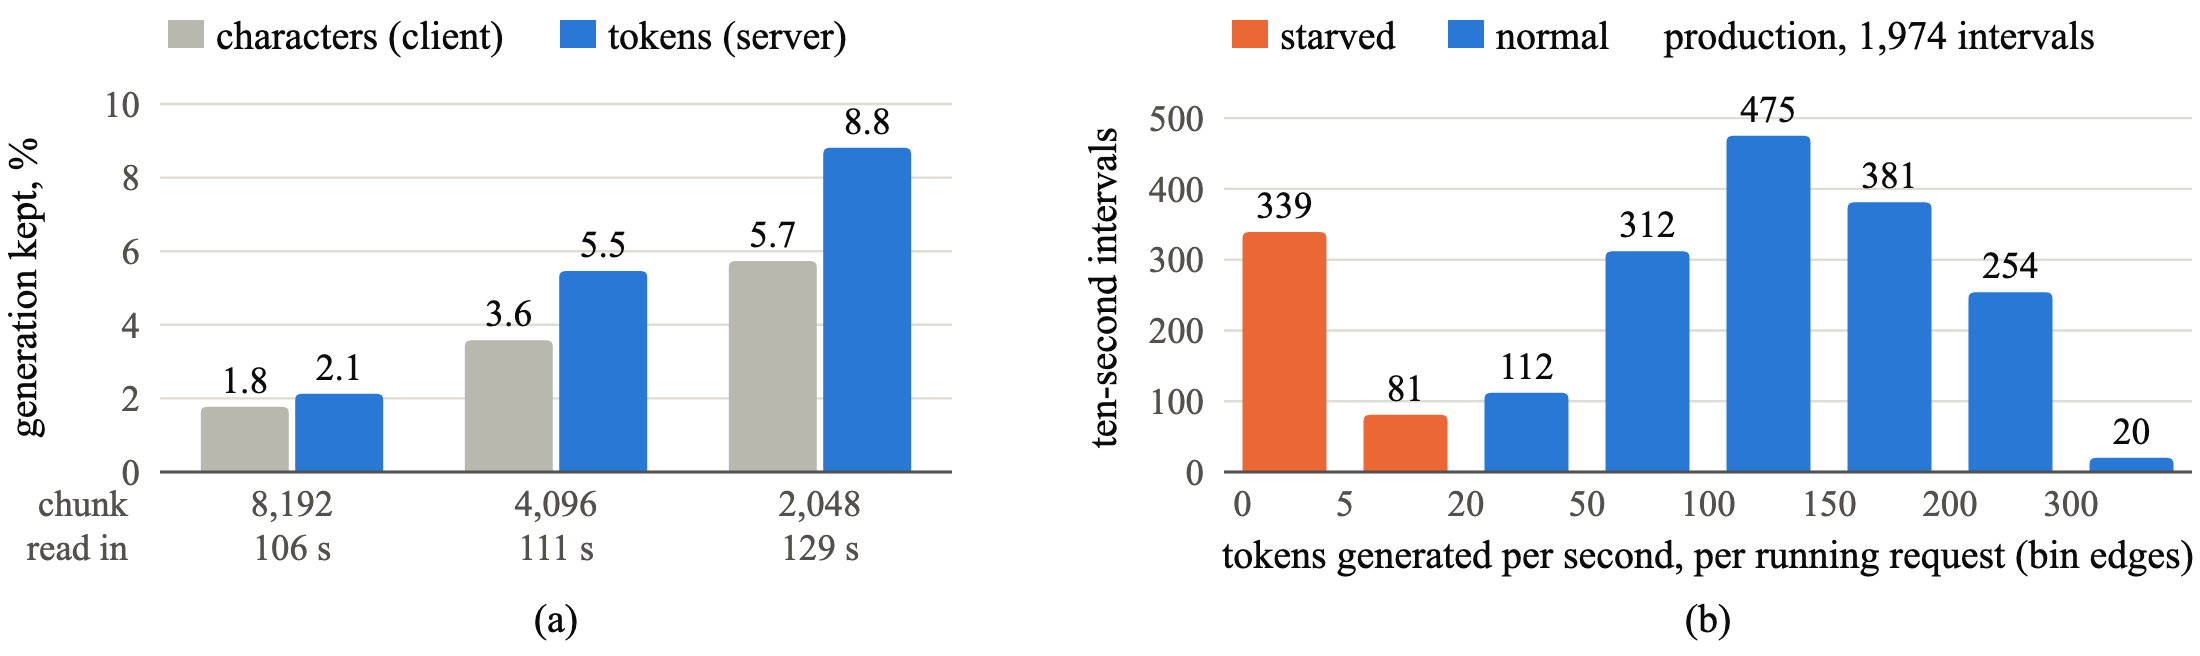
Figure 1. (a) Controlled test on the H200: share of generation kept while three cold prompts are read, by chunk size and by measure (token shares are upper bounds), with the time to read all three. (b) Production: busy ten-second intervals by tokens generated per second per running request, in bins of unequal width. Those under 20 are the starved ones.
In production, 1.5% of the gaps take 25 to 35% of the time. Of 3.79 million gaps between decoding steps, 98.1% are under 25 ms. 58,483 gaps last 0.1 s or more, all but 27 of them under 0.75 s. In the model a step lasts as long as the prompt tokens it carries, so gaps under 0.4 s (53% of the slow ones) would be partly filled chunks; 46% lie between 0.4 and 0.75 s, where a full chunk of 8,192 tokens falls (0.48 to 0.55 s at the 15 to 17 thousand tokens per second of this server’s acceptance tests). By bucket bounds the slow gaps add up to 25 to 35% of gap time.
In a fifth of busy intervals each stream generates 5.4 to 5.6 tokens per second. Of 1,974 busy intervals, 420 (21%) are starved; the intervals fall into two clusters with only 81 between 5 and 20 tokens per second (Figure 1b). In a starved interval each generating stream produces 5.4 to 5.6 tokens per second whatever the number of requests, against 103 to 158 in the others: 3.5 to 5.4% (Table 2). The model predicts this rate: 2.98 tokens per step over the 0.48 to 0.55 s of a chunk is 5.4 to 6.2 tokens per second. Runs of consecutive starved reports (no more than 15 s apart) form 170 episodes (158 to 224 at thresholds of 10 and 50); 82 last 30 s or longer and the longest 130 s. The report after an episode credits a median of 282K computed prompt tokens, against 16K after other busy intervals, and 20K or more in 89% of cases against 41% (50K or more in 82% against 13%): episodes end with a large prompt credit. Requests are waiting in 65% of starved intervals and in 7% of the others.
Table 2. Production: busy ten-second intervals by requests running. Starved: under 20 generated tokens per second per running request. Rates are per generating stream: all running requests in a normal interval, all but one in a starved one. Bold: share kept.
| Requests running | Intervals | Starved intervals | Starved share, % | Normal, tokens/s per generating stream | Starved, tokens/s per generating stream | Kept, % |
|---|---|---|---|---|---|---|
| 2 | 1,001 | 165 | 16 | 158 | 5.6 | 3.5 |
| 3 | 420 | 97 | 23 | 135 | 5.5 | 4.1 |
| 4 | 223 | 56 | 25 | 113 | 5.4 | 4.7 |
| 5 or more | 330 | 102 | 31 | 103 | 5.6 | 5.4 |
Limitations
The controlled runs are one per setting, with no variance estimate, on a mid-size dense model (Model B); production is a large mixture-of-experts model (Model A) with a host-RAM cache tier [6] also at work. Three of the H200 runs followed a restart, so their normal rate is taken from the one run on a warmed server (against each run’s own rate after the read the character shares are 1.8, 3.2, 6.4 and 3.5%). These runs hold the chunk comparison, and their rates before the read, 1,011 to 1,114 characters per second against 5,251, show warm-up: a chunk effect cannot be told from a restart effect. Characters and tokens disagree at the smaller chunks; characters per token may not have been constant, and each token baseline is the arrival report, which holds the start of the read: on the H200 the send fell 2.4 to 6.3 s before its end, so the normal rate is at least 794 tokens per second, not 607, and the share at 8,192 tokens at most 1.6%. The production analysis is observational (one server, one window, no session identity). Reports sample the number of running requests at one instant; the per-stream rates assume that one request is reading; the threshold of 20 tokens per second is read off the gap between two clusters, and thresholds of 10 and 50 give 20% and 27% of busy intervals; an interval may span two prompts read in turn; and the histogram gives bucket bounds, not durations. Speculative decoding was on in every run. We did not test a chunk under 2,048 tokens, a chunk that adapts [5], separate machines [3, 4], or the server’s own limits on concurrent partial prefills and its long-prefill threshold (both at their defaults throughout), nor whether the servers’ software already runs both phases at once [7, 8].
Recommendations
- Put a mixed test into acceptance: generating streams plus cold long prompts, reporting generation during the read. A short-prompt benchmark ran without an error on a server that kept about 2%.
- Watch gaps and per-interval generation, not averages: the mean gap was 18 ms while 1.5% of gaps took 25 to 35% of the time.
- Treat the chunk as a trade-off [2, 5]: in one restarted run, 2,048 tokens gave 3.2 to 4.1 times the generation of 8,192 at 22% slower reading.
- Read less cold. A prompt served from a cache is not read again; on the production server a host-RAM tier supplied 16% of what the GPU cache missed [6].
Disclosure. Tests and analysis used AI coding agents under the author’s direction; production records were read without changing the live server. Numbers were recomputed from result files and server records; character rates and short-prompt throughput are the test clients’ own summaries.
References
- G.-I. Yu, J. S. Jeong, G.-W. Kim, S. Kim, and B.-G. Chun. Orca: A distributed serving system for transformer-based generative models. In OSDI, 2022. USENIX
- A. Agrawal, N. Kedia, A. Panwar, J. Mohan, N. Kwatra, B. Gulavani, A. Tumanov, and R. Ramjee. Taming throughput-latency tradeoff in LLM inference with Sarathi-Serve. In OSDI, 2024. arXiv:2403.02310.
- Y. Zhong, S. Liu, J. Chen, J. Hu, Y. Zhu, X. Liu, X. Jin, and H. Zhang. DistServe: Disaggregating prefill and decoding for goodput-optimized large language model serving. In OSDI, 2024. arXiv:2401.09670.
- P. Patel, E. Choukse, C. Zhang, A. Shah, Í. Goiri, S. Maleki, and R. Bianchini. Splitwise: Efficient generative LLM inference using phase splitting. In ISCA, 2024. arXiv:2311.18677.
- A. Agrawal, H. Qiu, J. Chen, Í. Goiri, C. Zhang, R. Shahid, R. Ramjee, A. Tumanov, and E. Choukse. No request left behind: Tackling heterogeneity in long-context LLM inference with Medha. arXiv:2409.17264, 2024 (revised 2025).
- Y. Akinin. A host-RAM tier for the KV cache: Up to 33× sooner after eviction, 16% of cache misses served in production. AVELIN AI Lab Research Note, October 2026.
- A. K. Kamath, R. Prabhu, J. Mohan, S. Peter, R. Ramjee, and A. Panwar. POD-Attention: Unlocking full prefill-decode overlap for faster LLM inference. In ASPLOS, 2025. arXiv:2410.18038. doi:10.1145/3676641.3715996
- K. Hong, L. Chen, Z. Wang, X. Li, Q. Mao, J. Ma, C. Xiong, G. Wu, B. Han, G. Dai, Y. Liang, and Y. Wang. semi-PD: Towards efficient LLM serving via phase-wise disaggregated computation and unified storage. arXiv:2504.19867, 2025.
How to cite
Y. Akinin. Reading a Long Cold Prompt Starves Generation: About 2% of Normal Speed at an 8,192-Token Chunk. AVELIN AI Lab Research Note, October 2026. https://avelin.ai/lab/reading-a-long-cold-prompt-starves-generation
@techreport{akinin2026coldpromptstalls,
  title       = {Reading a Long Cold Prompt Starves Generation: About 2% of Normal Speed at an 8,192-Token Chunk},
  author      = {Akinin, Yury},
  institution = {AVELIN AI},
  year        = {2026},
  month       = oct,
  url         = {https://avelin.ai/lab/reading-a-long-cold-prompt-starves-generation}
}